Can Anthropographics Promote Prosociality?
Luiz Morais, Yvonne Jansen, Nazareno Andradde, and Pierre Dragicevic
Visualizations designed to make readers compassionate with the persons whose data is represented have been called anthropographics and are commonly employed by practitioners. Empirical studies have recently examined whether anthropographics indeed promote empathy, compassion, or the likelihood of prosocial behavior, but findings have been inconclusive so far. This work contributes a detailed overview of past experiments, and two new experiments that use large samples and a combination of design strategies to maximize the possibility of finding an effect. We tested an information-rich anthropographic against a simple bar chart, asking participants to allocate hypothetical money in a crowdsourcing study. We found that the anthropographic had, at best, a small effect on money allocation. Such a small effect may be relevant for large-scale donation campaigns, but the large sample sizes required to observe an effect and the noise involved in measuring it make it very difficult to study in more depth.
This is a companion website for the paper:
Morais, Luiz, Yvonne Jansen, Nazareno Andrade, and Pierre Dragicevic. Can Anthropographics Promote Prosociality? A Review and Large-Sample Study. In CHI 2021 Conference on Human Factors in Computing Systems.
On this page you can test the experiment yourself. More material, including data, analyses and preregistrations, is available on our OSF repository.
The experiment pages linked to below are static versions for each condition which were exported using the Chrome plugin SingleFile.
Experiment 1
Conditions
Experiment 1 included two conditions which can be explored by clicking on the icons below.
Poor-First Condition
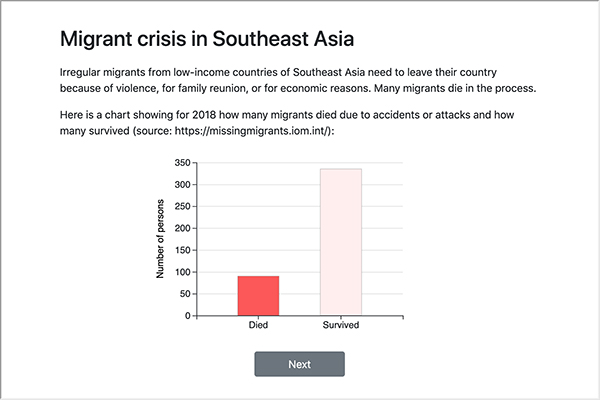
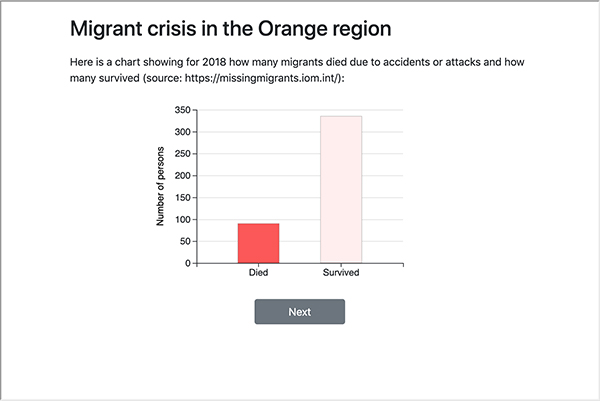
This condition presents first the information-poor visualization (bar chart), then the information-rich one.
Rich-First Condition
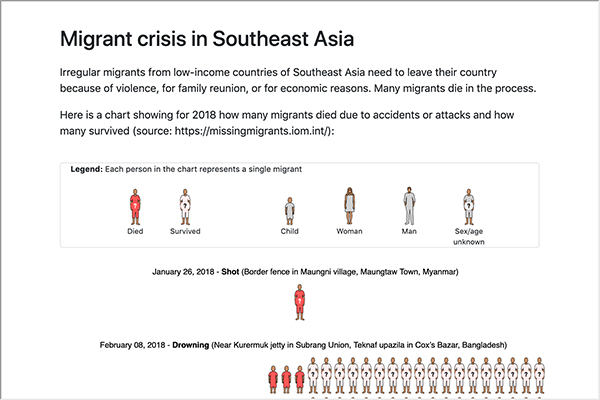
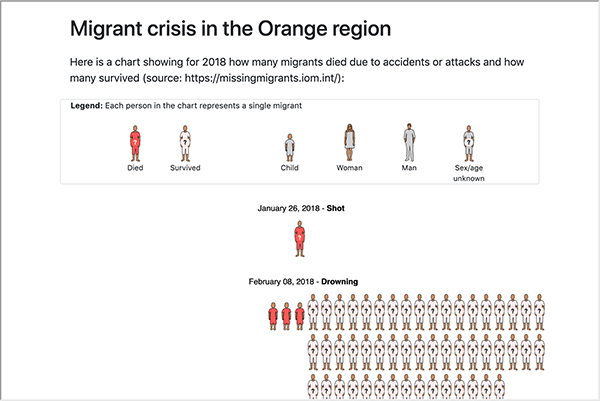
This condition presents first the information-rich condition (anthropographic), then the information-poor one.
Pre-registration
The design and analysis of the experiment was pre-registered on OSF. The pre-registration document can be consulted here (external link).
Results
The results from our planned analysis can be consulted here.
In addition to the planned analysis we also performed 3 additional, unplanned analyses
- a summary of the justifications participants gave,
- an analysis how much time they spent on the different pages, and
- a calculation of our effect sizes in terms of standardized effect sizes.
Experiment 2
The second experiment included four conditions crossing the two factors information-richness and anonymization of regions.
Information-Poor + Non-Anonymized Condition
This condition only shows the information-poor condition (bar chart) while maintaining the identity of the region (South-East Asia).
Information-Rich + Non-Anonymized Condition
This condition only shows the information-rich condition (anthropographic) while maintaining the identity of the region (South-East Asia).
Information-Poor + Non-Anonymized Condition
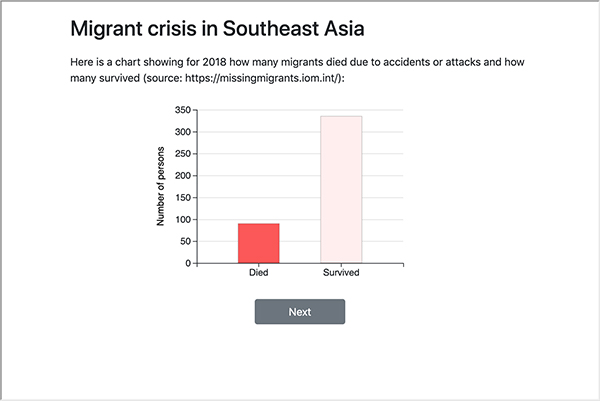
This condition only shows the information-poor condition (bar chart) while hiding the identity of the region.
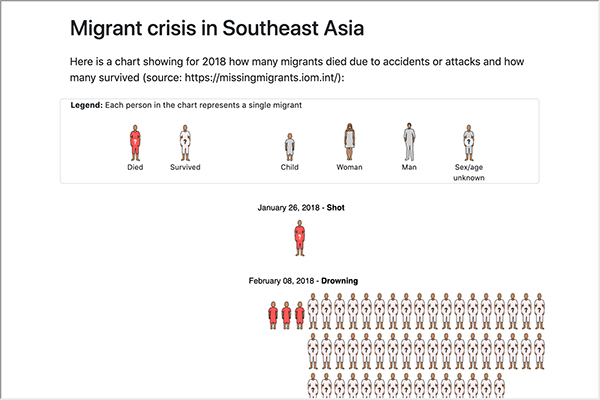
Information-Rich + Anonymized Condition
This condition only shows the information-poor condition (bar chart) while hiding the identity of the region (South-East Asia).
Pre-registration
Like experiment 1, the design and analysis for this experiment was planned in advance and pre-registered on OSF. The pre-registration document can be consulted here (external link).
Results
The results from our planned analysis can be consulted here.
In addition to the planned analysis we also performed 2 additional, unplanned analyses
- an analysis how much time they spent on the different pages, and
- a calculation of our effect sizes in terms of standardized effect sizes.